
How To Use The Boundary Tool
Using the Boundary Tool in Maptive can help you segment information on your map in order to quickly identify trends in your data. This tutorial will provide you with everything you need to know when it comes to using the Boundary Tool.
To use the Boundary Tool, follow these steps:
Step 1: Open Map Tools.

Step 2: Open the Boundary Tool.

Step 3: Select Boundary Type. These are some of the options you can choose from:

Step 4: Select Boundary Fill Type. You have 4 options:
1. No Fill
2. My Numerical Data
3. My Group Data
4. Demographic Census Data

Selecting No Fill: How to Proceed
When you select No Fill as your boundary fill type, you will simply see the boundary lines based on the boundary type you selected. You will also see labels based on the boundary type you selected. For example, this is what you would see if you selected US - States as your boundary type and chose No Fill:

As you move your cursor over different states, they will highlight as seen above. To change the boundary line width or boundary line color on your map, click into Boundary Settings:


Selecting My Numerical Data: How to Proceed
When you select My Numerical Data as your boundary fill type, your next step will be to choose your boundary fill data. Select one of your numerical columns to shade in numerical ranges (like sales).

When you have selected one of your numerical columns, click Add Boundary+ to create your boundary:
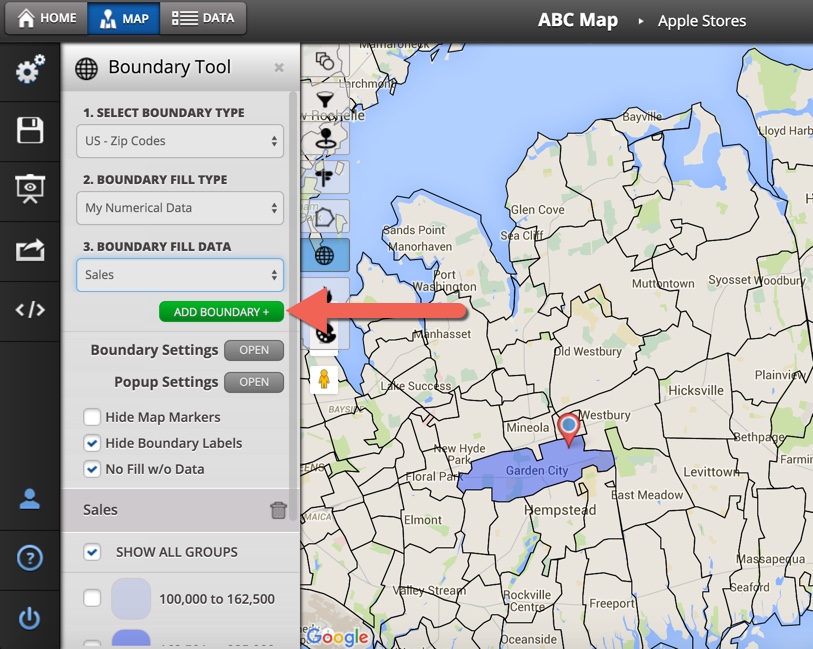
In the example below, we selected US - Zip Codes as the boundary type, My Numerical Data as the boundary fill type, and Sales as the Boundary Fill Data:

A few things to point out:
(1). After you create your boundary, you will see a color key that displays ranges for the numerical column you selected (in this case, it was Sales).
(2). Each boundary will have a marker info popup that appears when you click on the boundary. The marker info popup will designate each boundary on your map. In this case, it is showing the zip code for each boundary.
(3) The marker info popup will also tell you how many locations fall within each boundary.
(4) You can also add additional information to your marker info popup. In this case, we chose to display the sum of all sales for the locations that fall within each boundary.
Note: This is what the map marker info popup would look like with multiple locations within the boundary. Here we selected US- States for the boundary type, My Numerical Data for the boundary fill type, and Sales for the boundary fill data:

Selecting My Group Data: How to Proceed
When you select My Group Data as your boundary fill type, your next step will be to choose your boundary fill data. Select one of your text group columns to shade by group (like sales reps). This can be used to group multiple geographic boundaries together as a territory.
In the example below, we've selected US - States for our boundary type, My Group Data for our boundary fill type, and the Sample Group column in our data for our boundary fill data.

Once your boundaries have been created in your map, you can toggle off and on different groups, as shown below:

As mentioned above, this can be used to group multiple geographic boundaries together as a territory. You can even combine group totals by clicking the check box in the boundary tool window:

In this example, combining group totals gave us the total number of locations within Example Group 5, as opposed to just the number of locations within 1 state on our map:


Selecting Demographic Census Data: How to Proceed
When you select Demographic Census Data as your boundary fill type, your next step will be to choose your Demographic Group. You can choose from the following options:
- Population
- Race
- Housing
- Age
- Citizenship Status
- Education
- Income
- Transporation
- Labor
- Gender

After you have selected the Demographic Group, your next step will be to choose your boundary fill data. The options you have to select from will vary depending on the Demographic Group you choose. When you've selected your boundary fill data, click the Add Boundary+ button to add boundaries to your map.
In the example below, we chose Race for the Demographic Group and Percentage Black for the Boundary Fill Data:

As you can see from the example above, once you create your boundaries, you'll see them appear on your map. You'll also see a color key in your tool window that shows the groups and associated percentages. You can also click on any state to open the info popup and see the percentage:

How to Customize Your Boundary Marker Info Popups
To add additional information to your info popups, follow these steps:
Step 1: Click into Popup Settings:

Step 2: Select your numerical data column.

Step 3: Select Action. In this case, we are choosing SUM (TOTAL).
Step 4: Click Add To Boundary Popup.

Step 5: When you see that your Summary Data has been added, click Done to finalize the customization. Your data will now appear on your marker info popup.


Adding More Customization To Your Boundaries
There are a number of ways you can customize the boundaries that appear on your map, as described below:
1. You can open Boundary Settings to customize ranges, boundary line width, master fill color, individual fill colors for groups, fill opacity, and boundary line color.
2. You can customize the information that appears in the info popups associated with your boundaries.
3. You can hide map markers to simplify your map view.
4. You can hide boundary labels to simplify your map view.
5. You can select "No Fill w/o Data" to disable boundaries that don't include any locations.

You can now export the data within your boundaries all at once. Just set your boundaries and click the Export to File button at the bottom of the Boundary tool. This will export all the data from all of your boundaries/territories along with the boundary/territory name.
