
How to Use The Filter Tool
Filter Tool Tutorial:
The Filter Tool allows you to segment your data and view it at multiple levels of granularity on a single map. It makes it easy to see relationships between data points while paring down heavy spreadsheet data to only what you want to see. To use the Filter Tool, follow the steps outlined below:
Step 1: Open Map Tools.

Step 2: Open the Filter Tool.

Step 3: Click on Filter Settings. If you've never been in the Filter Tool before, this will open automatically for you:

After clicking you'll see the following menu, showing all the columns in your data. You can then choose which columns can be filtered and how.

Step 4: Customize your map by creating filters. You create filters by first turning them on, and then by selecting the type of filter you want to apply.


There are four types of filters you can create:
- group
- text
- number
- attribute
What Group Filters Look Like
Here's an example of what a group filter looks like. In this example, states on the map are being filtered by group:

What Text Filters Look Like
Here's an example of what a text filter looks like. In this example, states on the map are being filtered by text:
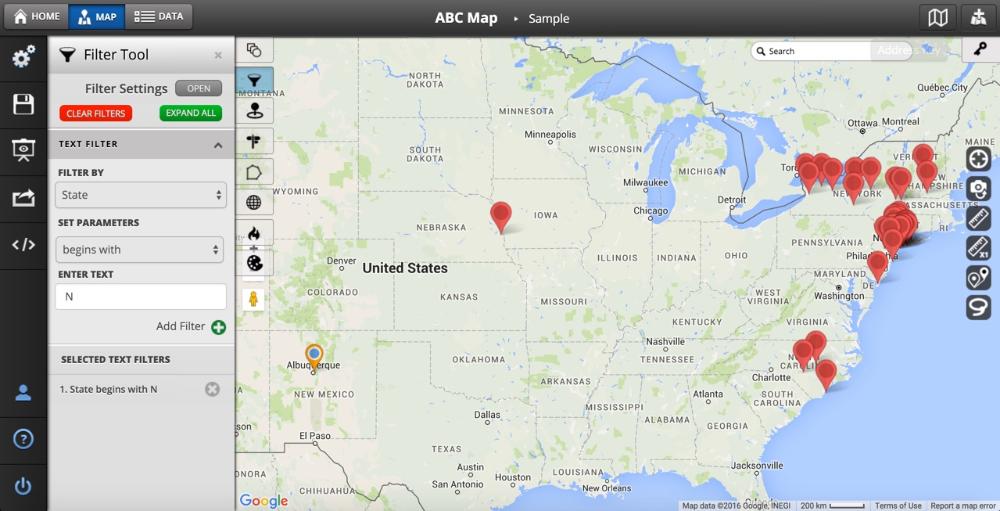
In text filters, you filter by your text-based column, and you can set the following parameters to build your filter:

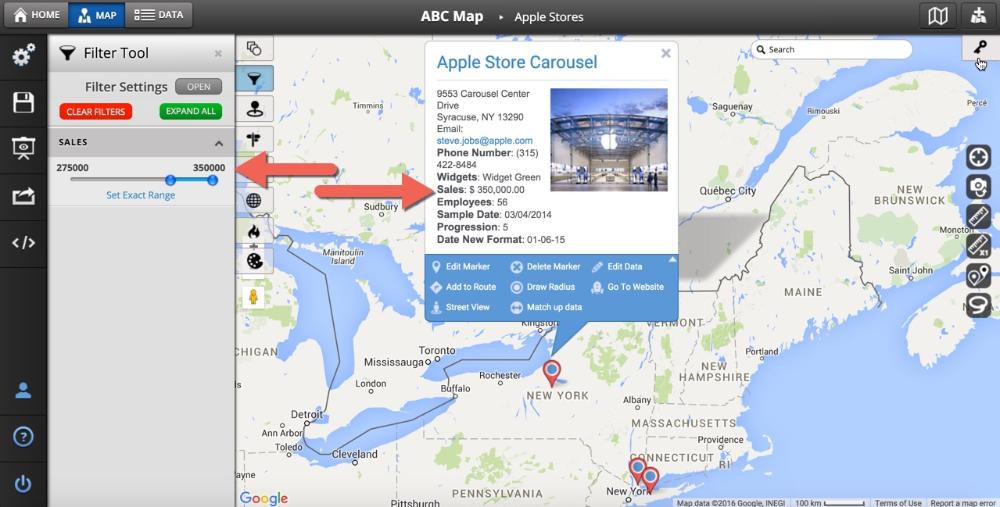
What Number Filters Look Like
Here's an example of what a number filter looks like. In this example, locations on the map are being filtered by ranges of sales:
What Attribute Filters Look Like
Here's an example of what an attribute filter looks like. In this example, locations on the map can be filtered by reported sales:
